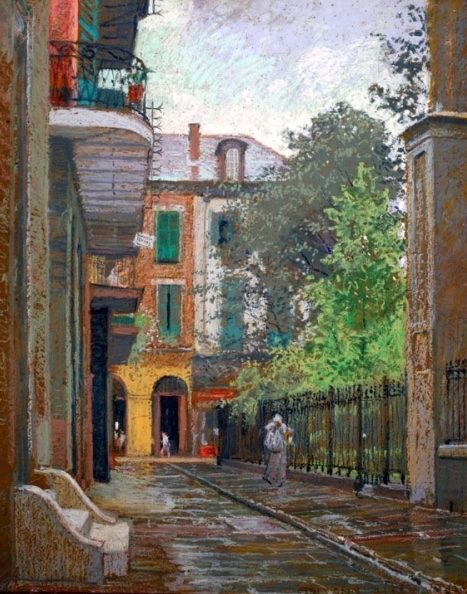
William Woodward’s Orleans (Photo: Public Domain)
“For urban theorists, the center/place dichotomy exemplifies one type of urban power structure. Within the urban cultural center, elites control cultural resources and the production of symbols through its institutions of culture.” –Grams, Diane. Producing Local Color: Art Networks in Ethnic Chicago. Chicago: University of Chicago Press, 2010.
Some cities are organized around a central downtown cultural core resulting in a small group of elite art patrons exerting control over a city’s cultural offerings. New Orleans has a history and layout of its city different from this model. Its cultural districts are varied and more equally distributed. At one point, the Louisiana State Legislature established 19 cultural districts in New Orleans. These districts serve “…the purpose of revitalizing a community by creating a hub of cultural activity” (1).
We sought to understand if and how such investment might influence how art is displayed and sold. To do this, we developed a dataset of all nonprofit and commercial galleries and sought to understand neighborhood effects. As residents or tourists might expect, art galleries in the Garden District varied greatly from those in the French Quarter. Whereas a gallery in the CBD might target collectors, the French Quarter would likely target tourists. Due to the differences in these distinct areas, how do galleries in the neighborhoods employ different tactics to appeal to their patrons?
This begs the research question: How does neighborhood clustering affect selection and display of art among galleries in different districts?
We decided to focus on art galleries to see where they were located out of curiosity to discover how galleries were clustered in New Orleans. Each district’s art galleries provided insight into the role of businesses in each area and how each district varied from the districts around it.
We sought to create a list of the entire universe of art galleries in New Orleans by compiling a list from Internet searches on Guidestar.org and commercial gallery listings. An initial list of 120 gallery names and addresses were recorded, with contact information and descriptions when available. This information was put into an Excel chart. The addresses on this initial list were mapped to identify clusters of galleries throughout the city. Unlike the 19 legislated districts, 8 primary districts were identified that contained clusters of observed art galleries. Of these 8 districts, 5 had the heaviest concentration of gallery clustering.
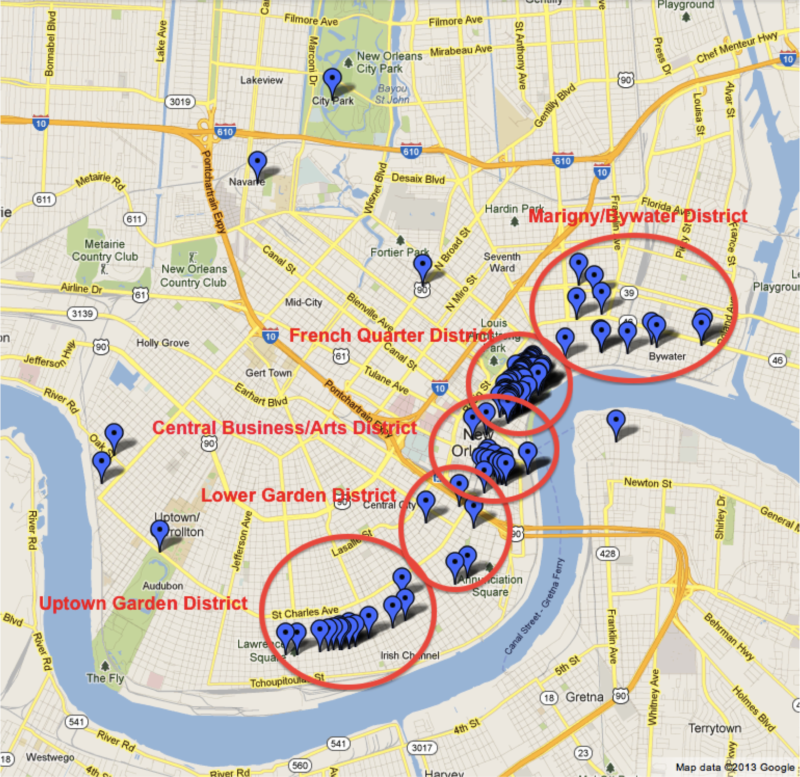
A map of New Orleans Galleries. Photo by Chris Abdo.
Using this map electronically between an iPad and iPhone, it was possible to visit each gallery identified, observe and record respective attributes as well as add new galleries to the Excel table not found in the original Internet searches. As was to be expected, some of the information found on the galleries proved to be inaccurate. Some galleries were nearby, but at addresses other than those listed or were closed and unavailable completely. During this process, 43 additional galleries were identified creating a list of 163 for our universe of galleries. These were added to the list, mapped and visited. However, 24 were not found and therefore removed.
At each gallery, common characteristics found in an art gallery were documented including price range, featured artists, and presentation style. Data from the Excel table was imported into a statistical program, SPSS, to test a number of hypothesis:
Neighborhood location created access to specific types of gallery visitors which informed both art selection and presentation.
Display of art in different districts would follow norms for tourist trade, museum trade, or interior design trade.
Galleries owned and run by an artist would be limited to artist communities.
Using SPSS, the data was coded and then analyzed to create observable trends from the overall data in order to answer the research question being asked.
*It should be noted that it was planned to get a personal perspective from gallery owners themselves via interviews. However, due to scheduling problems, none of the owners were able to do so. In future studies, it would be worthwhile to get their personal feedback in order to gain a deeper, complete view of art galleries in New Orleans.
Mapping addresses revealed the clustering of art galleries in multiple neighborhoods. These clusters were identified as: the French Quarter District, the Central Business/Arts District, the Lower Garden District, the Uptown Garden District, and the Marigny/Bywater District. The galleries that did not fall into these districts were identified as Other.
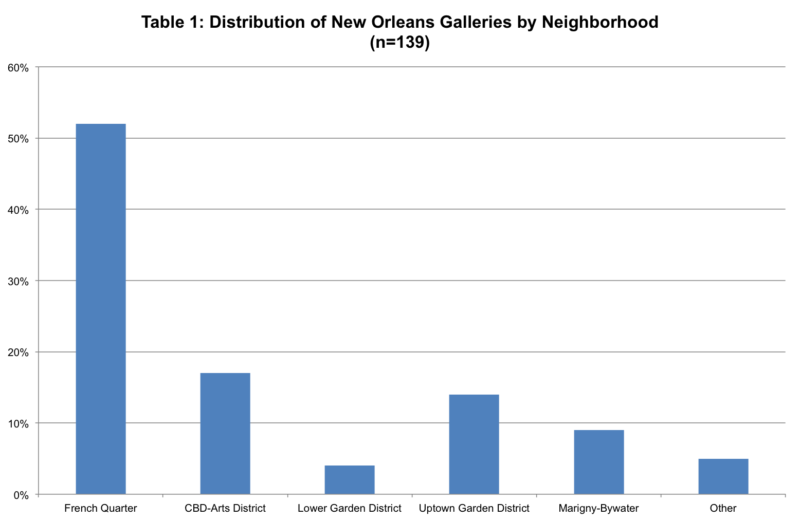
Galleries by district. Photo by Chris Abdo.
With analysis of data through SPSS, numerous trends are observable. Clustering in each district revealed characteristics such as neighborhood, presentation style, and price range. For example, using the program, neighborhoods were cross-tabulated with layout styles to find strong correlations between an area and its presentation style.
With 139 galleries observed, these findings reveal the trends:
The galleries in New Orleans were distributed accordingly: French Quarter 52%, CBD 17%, Uptown Garden District 14%, Marigny/Bywater 9%, Lower Garden District 4%.
From the information that was obtained, the founding years of the observed galleries ranged from 1966 to 2010 with the median year being 1990.
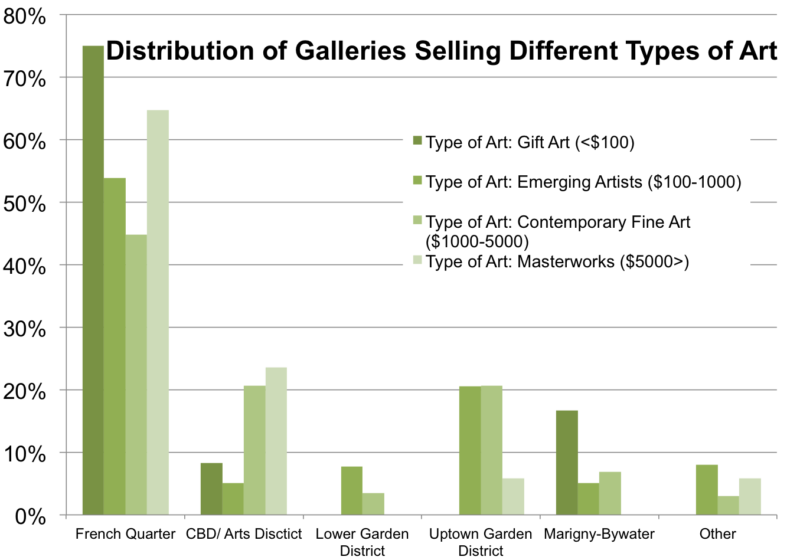
Galleries by type. Photo by Chris Abdo.
In 36% of all galleries observed, the owner was the featured artist and the gallery was intended to show his/her works. The concentrations of galleries with an owner being the featured artist were the following: 58% Marigny/Bywater, 36% French Quarter, 35% Uptown Garden District, 26% CBD, and 20% Lower Garden District.
Most galleries, however, showed more than one artist (61%). In terms of all galleries having more than one artist, the correlations were Marigny/Bywater 25%, French Quarter 19%, and CBD 17%.
Only about one third of the galleries (35%) displayed the work in “museum style” presentation, that is featuring one artist’s works and arranging each work with lots of space around it. More than half of all galleries (51%) showed only original art works, but often these were displayed salon-style.
Showing many artworks in “salon style,” was the dominant display format in French Quarter; whereas in other districts a museum style of display dominated.
Most galleries in all districts featured original artworks, but nearly 90% of the CBD galleries showed only one-of-a-kind works; 60% in Lower Garden District 60%, and 55% Uptown Garden District: 43% in the French Quarter showed only one- of-a-kind artworks.
As expected, the French Quarter has highest distribution of galleries selling gift art and masterworks (least expensive and most expensive artworks), the other hand, the CBD’s galleries focused on masterworks and contemporary fine art at 24% and 21%.
From this data, it is clear that the districts do have distinct characteristics that affect their display of art. The French Quarter, which had the largest concentration of galleries, appeared to be targeting a tourist audience as can be seen by the art pricing in the chart above. As such, most art sold is gift art in a “salon style” that presents as much art as it can to a tourist consumer. Whereas the CBD focused more on contemporary fine art and masterworks appealing to collectors and less of a tourist crowd. Galleries owned by artists were not limited to artist communities, but were found through out the city.
These data suggest that trends present in the characteristics of galleries in New Orleans are influenced by the neighborhood clustering. While this city is not organized around a central city as in Chicago, galleries are affected by the areas in which they are based. This is likely due to the audiences frequenting that neighborhood. In terms of improvement for similar future projects, more data could be obtained as some galleries did not provide pricing details. Our typologies to describe display practices and types of arts for sale may also be more fully developed using more detailed narratives supplied by the galleries.
Sources: